
Tools
Compare, side by side
Up to four options at a time. The best number in each row is highlighted — which is not always the one you should pick.
Quick comparisons:
Three one-bedroom investments
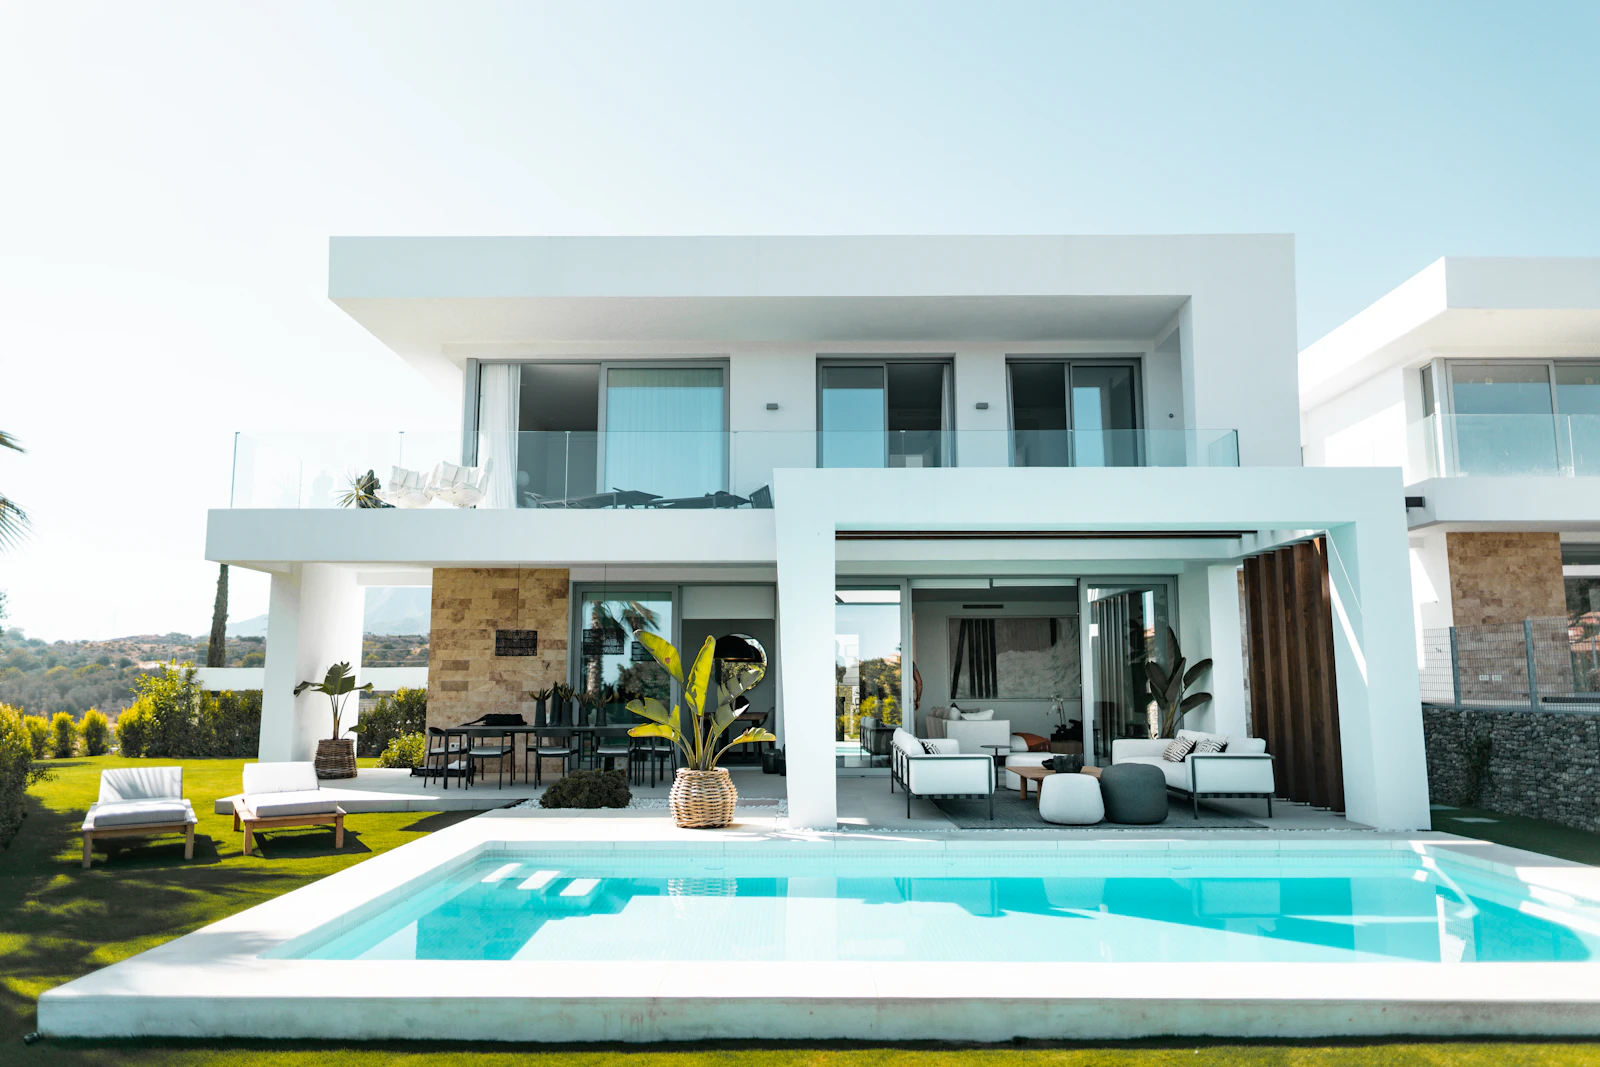 Bright studio in Al Furjan
Open |
 Corner 1-bedroom apartment in Arabian Ranches
Open |
 High-floor 1-bedroom apartment in Arjan
Open |
Add an option |
|
|---|---|---|---|---|
| Price | 953,000 | 1,831,000 | 90,000 | — |
| Price / sqft | 2,280 | 2,491 | — | — |
| Bedrooms | 0 | 1 | 1 | — |
| Bathrooms | 1 | 1 | 1 | — |
| Size (sqft) | 418 | 735 | 796 | — |
| Furnishing | Furnished | Unfurnished | Partially | — |
| Floor | 15 | 43 | 49 | — |
| Parking | 2 | 2 | 1 | — |
| Service charge / sqft | 24 | 14 | 18 | — |
| Gross yield | 7.7% | 5.9% | 5.4% | — |
| Status | Ready | Ready | Ready | — |
| Reference | HTH S0001 | HTH S0002 | HTH R0003 | — |
Highlighted cells show the most favourable figure in that row. “Best” on paper is not always best for you — service charges, layout and exit liquidity often matter more than headline price.